Currently Empty: $0.00
dpsoft.dp@gmail.com
- April 25, 2025
- Comment 0
Have you ever wondered, “Why does this feel like decoding alien language?” when faced with a mathematical problem?
The same here.
What if, however, mathematics didn’t have to be so… abstract? What if it felt more like a journey, a picture, or a story instead?
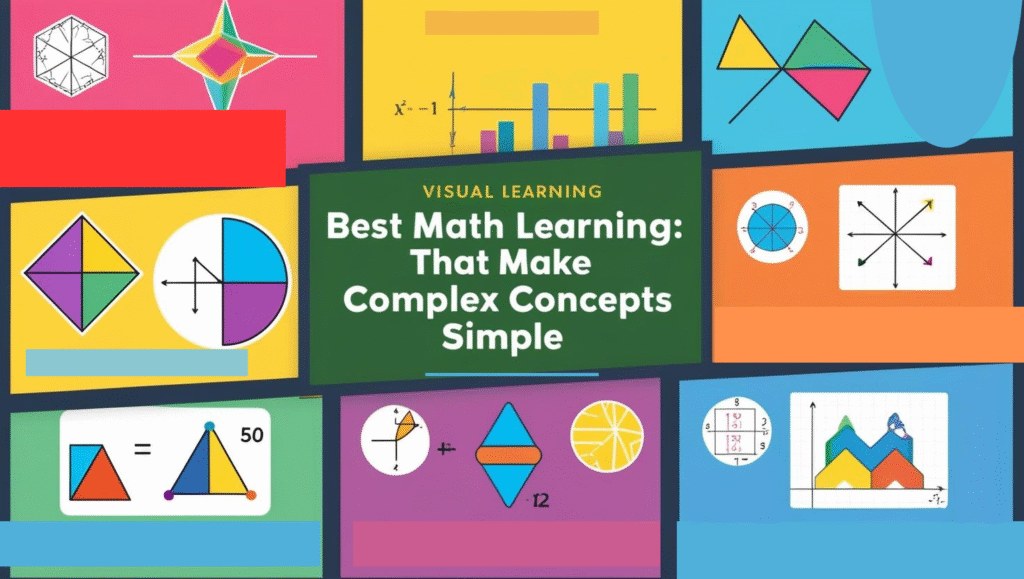
The power of visual learning in math is that it transforms ambiguity into clarity. And in math mastery today, we’re looking at the most effective math illustrations that simplify difficult ideas.
Because visuals are the scenic route to learning, which is also a journey.
Reasons Why Math Visual Learning Is Effective
First, let’s talk about why visual aids are so beneficial.
Text is processed by our brains 60,000 times slower than images. A graph, diagram, or color-coded chart can therefore quickly explain concepts that lengthy formulas cannot.
Therefore, visual aids are your best travel companion, regardless of whether you’re a teacher, student, or someone who is simply attempting to “get” math.
The Number Line: Where Math Meets Intuition
Best for: Understanding negative numbers, fractions, and basic arithmetic
A simple but powerful tool, the number line turns abstract operations into spatial movement.
- Subtracting a negative? Move right instead of left.
- Fractions? See why ½ is greater than ¼ at a glance.
Pro Tip: Use an interactive number line (like Desmos) to experiment in real time.
The Area Model: Multiplication & Factoring Made Obvious
Best for: Breaking down algebra and polynomials
Ever wondered why (x + 2)(x + 3) = x² + 5x + 6? The area model splits it into visual blocks:
|-------|-------|
|  x²   |  3x   |
|-------|-------|
|  2x   |   6   |
|-------|-------|
Now you can see where each term comes from!
The Unit Circle: Trigonometry Unlocked
Best for: Sine, cosine, and tangent functions
Instead of memorizing values, the unit circle visually connects angles to coordinates:
- cos(θ) = x-coordinate
- sin(θ) = y-coordinate
- tan(θ) = slope of the line
Tools like GeoGebra let you rotate the angle and watch the values change dynamically.
Pascal’s Triangle: Hidden Patterns Everywhere
Best for: Binomial expansions, combinations, and probability
This simple triangle holds Fibonacci sequences, powers of 2, and more:
       1
     1   1
   1   2   1
 1   3   3   1
1 4 6 4 1 - Each number is the sum of the two above it.
- The nth row gives coefficients for (x + y)ⁿ.
- The Graph of a Function:
- Calculus in Motion
- Best for: Derivatives, integrals, and limits
- A curve isn’t just a line—it tells a story:
- Slope (derivative) = steepness at any point
- Area underneath (integral) = total accumulation
- Tools like Desmos or Wolfram Alpha let you play with functions in real time.
The Mobius Strip: Mind-Bending Topology
Best for: Understanding infinity and non-orientable surfaces
Take a strip of paper, twist it once, and tape it. Suddenly:
- It has only one side!
- Cutting it creates paradoxical loops.
A perfect way to see abstract math in the real world.
The Mandelbrot Set: Infinite Beauty in Math
Best for: Fractals, complex numbers, and “math as art”
Zoom into this infinitely complex shape, and you’ll find self-repeating patterns at every level. It’s generated by a simple equation:
zₙ₊₁ = zₙ² + c
Yet the result is stunningly intricate—proof that math can be beautiful.
The Bridges of Königsberg: Graph Theory’s Birthplace
Best for: Networks, paths, and Eulerian circuits
This classic puzzle asks: Can you cross all seven bridges without retracing steps?
The answer (no!) led to graph theory, which now powers GPS navigation and social networks.
How to Use These Visuals in Learning
- Draw them yourself – Sketching reinforces understanding.
- Use interactive tools – Desmos, GeoGebra, and Wolfram Alpha bring math to life.
- Relate them to real life – Connect graphs to motion, fractals to nature.
Final Thought: Math Isn’t Just Numbers—It’s a Language of Shapes & Patterns
The best math visuals don’t just simplify—they inspire. Whether it’s the symmetry of Pascal’s Triangle or the infinite zoom of the Mandelbrot Set, seeing math in action makes it more intuitive, memorable, and even fun.
Which visual helped you the most? Got another favorite? Share in the comments!